According to WHO, 9 out of 10 people breathe polluted air. Yet, few people know that air pollution is the biggest environmental risk to human health. Every year, across every border on this planet, air pollution causes more than 7 million premature deaths. The magnitude of the problem should inspire sweeping change, but it doesn’t.
See More ➤ 31 Beautiful Quotes About Saving Mother Nature And Earth
It doesn’t matter if you believe in climate change or not, they all as human beings believe in living in a better environment, and that should be the main goal regardless of politics. What is air pollution? Learn how greenhouse gasses, smog, and toxic pollutants affect climate change, and human health.
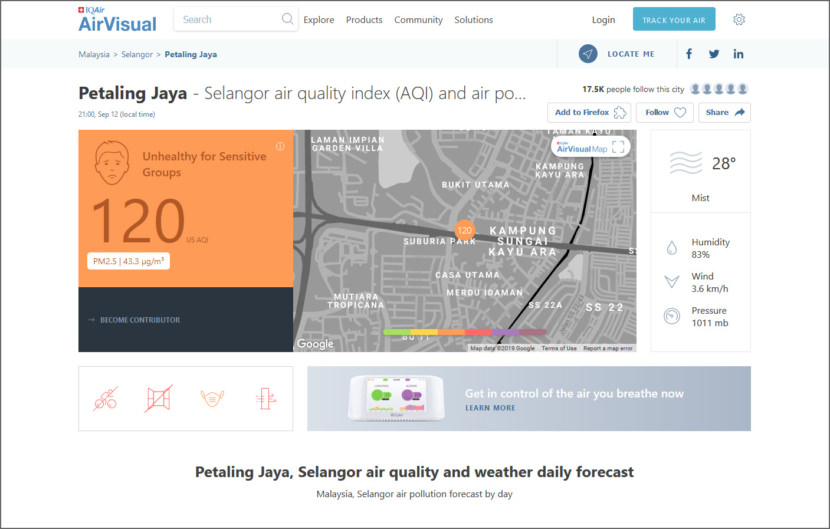
1. IQAir AirVisual
AirVisual was founded in 2015, on the belief that data enables action, and that without air quality data, the hazards of air pollution will remain invisible and unbeatable. AirVisual’s international team, now a part of IQAir, is passionate about empowering citizens through accessible technology to understand their environments and take control.
AirVisual’s groundbreaking air quality monitor, the AirVisual Node, was launched in September 2016 after a successful crowdfunding campaign. The new AirVisual Pro brings the latest developments in laser sensor technology and big data within anyone’s reach, as an affordable air monitor with unprecedented accuracy. The AirVisual Pro is your clean-air guru for maintaining a healthy indoor environment.
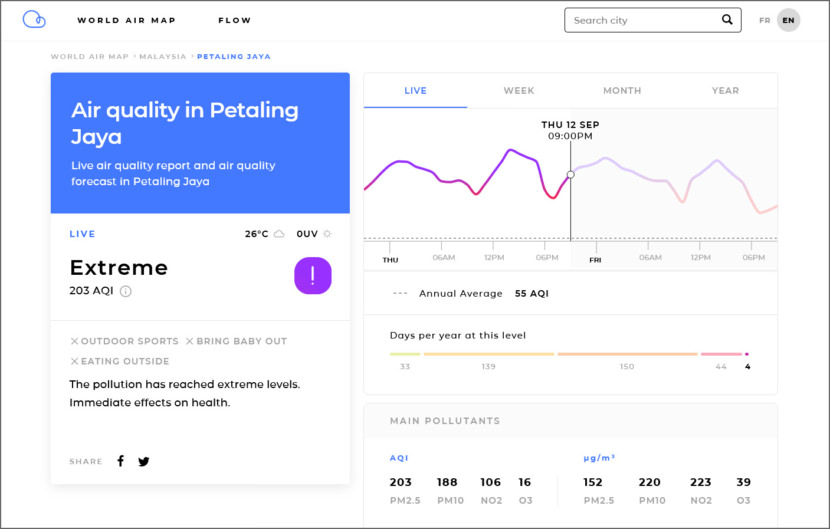
2. Plume Labs’ World Air Map
Plume Labs’ mission is to make environmental information accessible and empowering. Air pollution used to be invisible. AIR by Plume Labs reveals pollution peaks and fresh air moments throughout your day and throughout the world. Right on your phone, and as easy as checking the weather.
Get the live view of what your city is exposed to. AIR displays real-time indexes and concentrations of PM2.5, PM10, NO2 and O3. Because air pollution knows no border, AIR and its data is used every day by a community of hundreds of thousands of urban citizens, NGOs, and government agencies across the world.
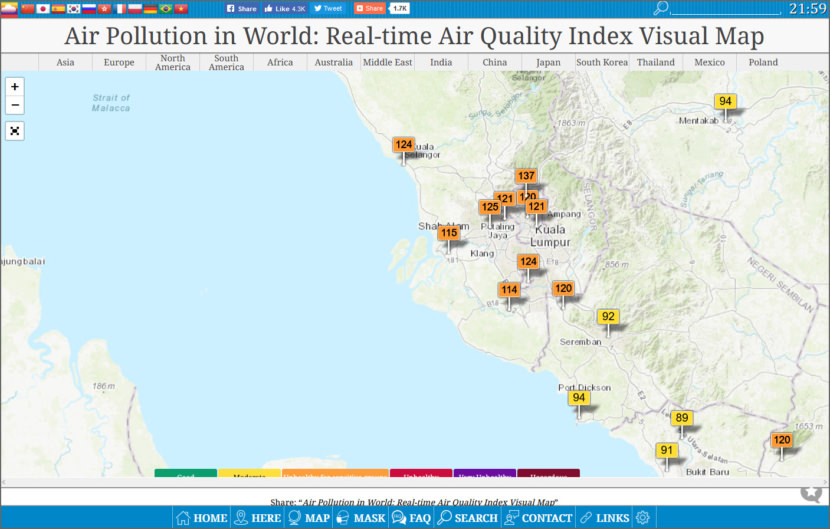
3. The World Air Quality Project
The World Air Quality Index project is a non-profit project started in 2007. Its mission is to promote air pollution awareness for citizens and provide a unified and world-wide air quality information. The project is providing transparent air quality information for more than 88 countries, covering more than 11,000 stations in 1000 major cities.
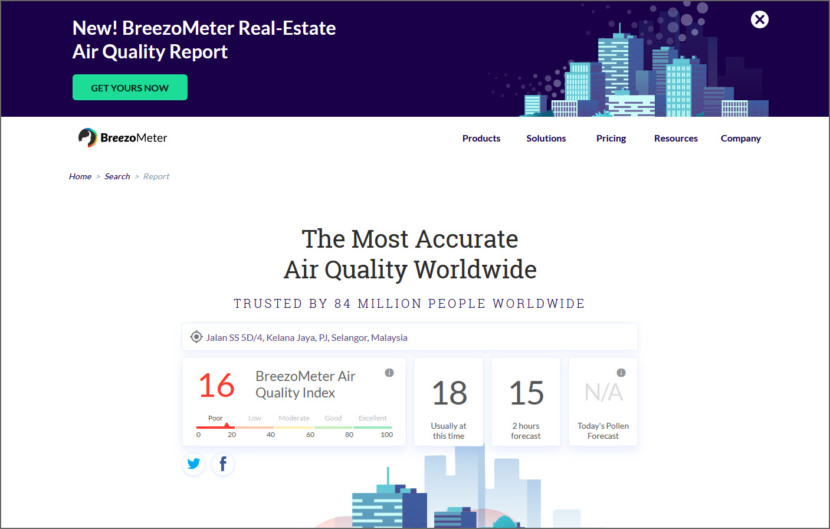
4. BreezoMeter Air Quality Index
BreezoMeter is an award-winning, world leader in location-specific real-time air quality data, already helping more than 5.5 billion people improve their health with actionable data. For the first time, you can see what is in the air you breathe, wherever you are, with this top-rated air quality App and Sites.
By collecting data from over 40,000 governmental sensors worldwide, traffic patterns, weather dynamics, satellite data and more, BreezoMeter uses BIG DATA infrastructure to validate over 1.8TB of data every hour, producing 440 million geographical data points. 7.5 billion compound calculations are then performed by proprietary dispersion algorithms, using machine learning techniques, to understand how air pollution moves and disperses.
5. Blueair Air View
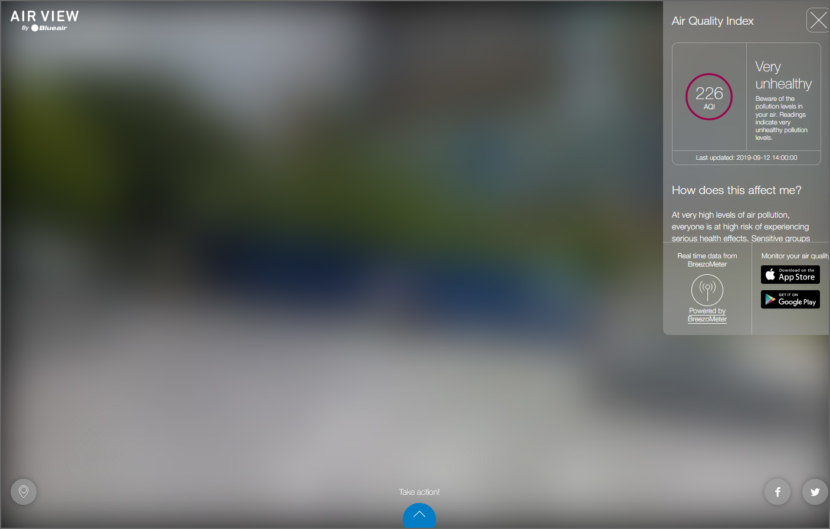
With Air View, you can see what’s in the air you are breathing right now. The Blueair Friend app and site tracks air quality outdoors at your position, or any place worldwide. The dominating pollutants in outdoor air are monitored down to a single city block and updated hourly: AQI (EPA index), particles (PM2.5, PM10), nitrogen dioxide (NO2,) sulfur dioxide (SO2), carbon monoxide (CO) and ozone (O3). The color coded heatmap gives you a fast overview of the air quality outdoors.


