
Data analysis tools refer to software applications or platforms designed to help individuals and organizations perform various tasks related to analyzing and interpreting data. These tools are used to process, manipulate, visualize, and draw insights from data, enabling users to make informed decisions, identify patterns, and uncover valuable information.
Related Article 😍💰👉 4 Stock Investment Sites With Useful Data, A.I. Analysis, Signals And Discussion
Data analysis tools are utilized in a wide range of fields, including business, science, finance, research, and more. The choice of data analysis tool depends on the specific needs of the analysis, the complexity of the data, and the expertise of the users.
1. ATLAS.ti
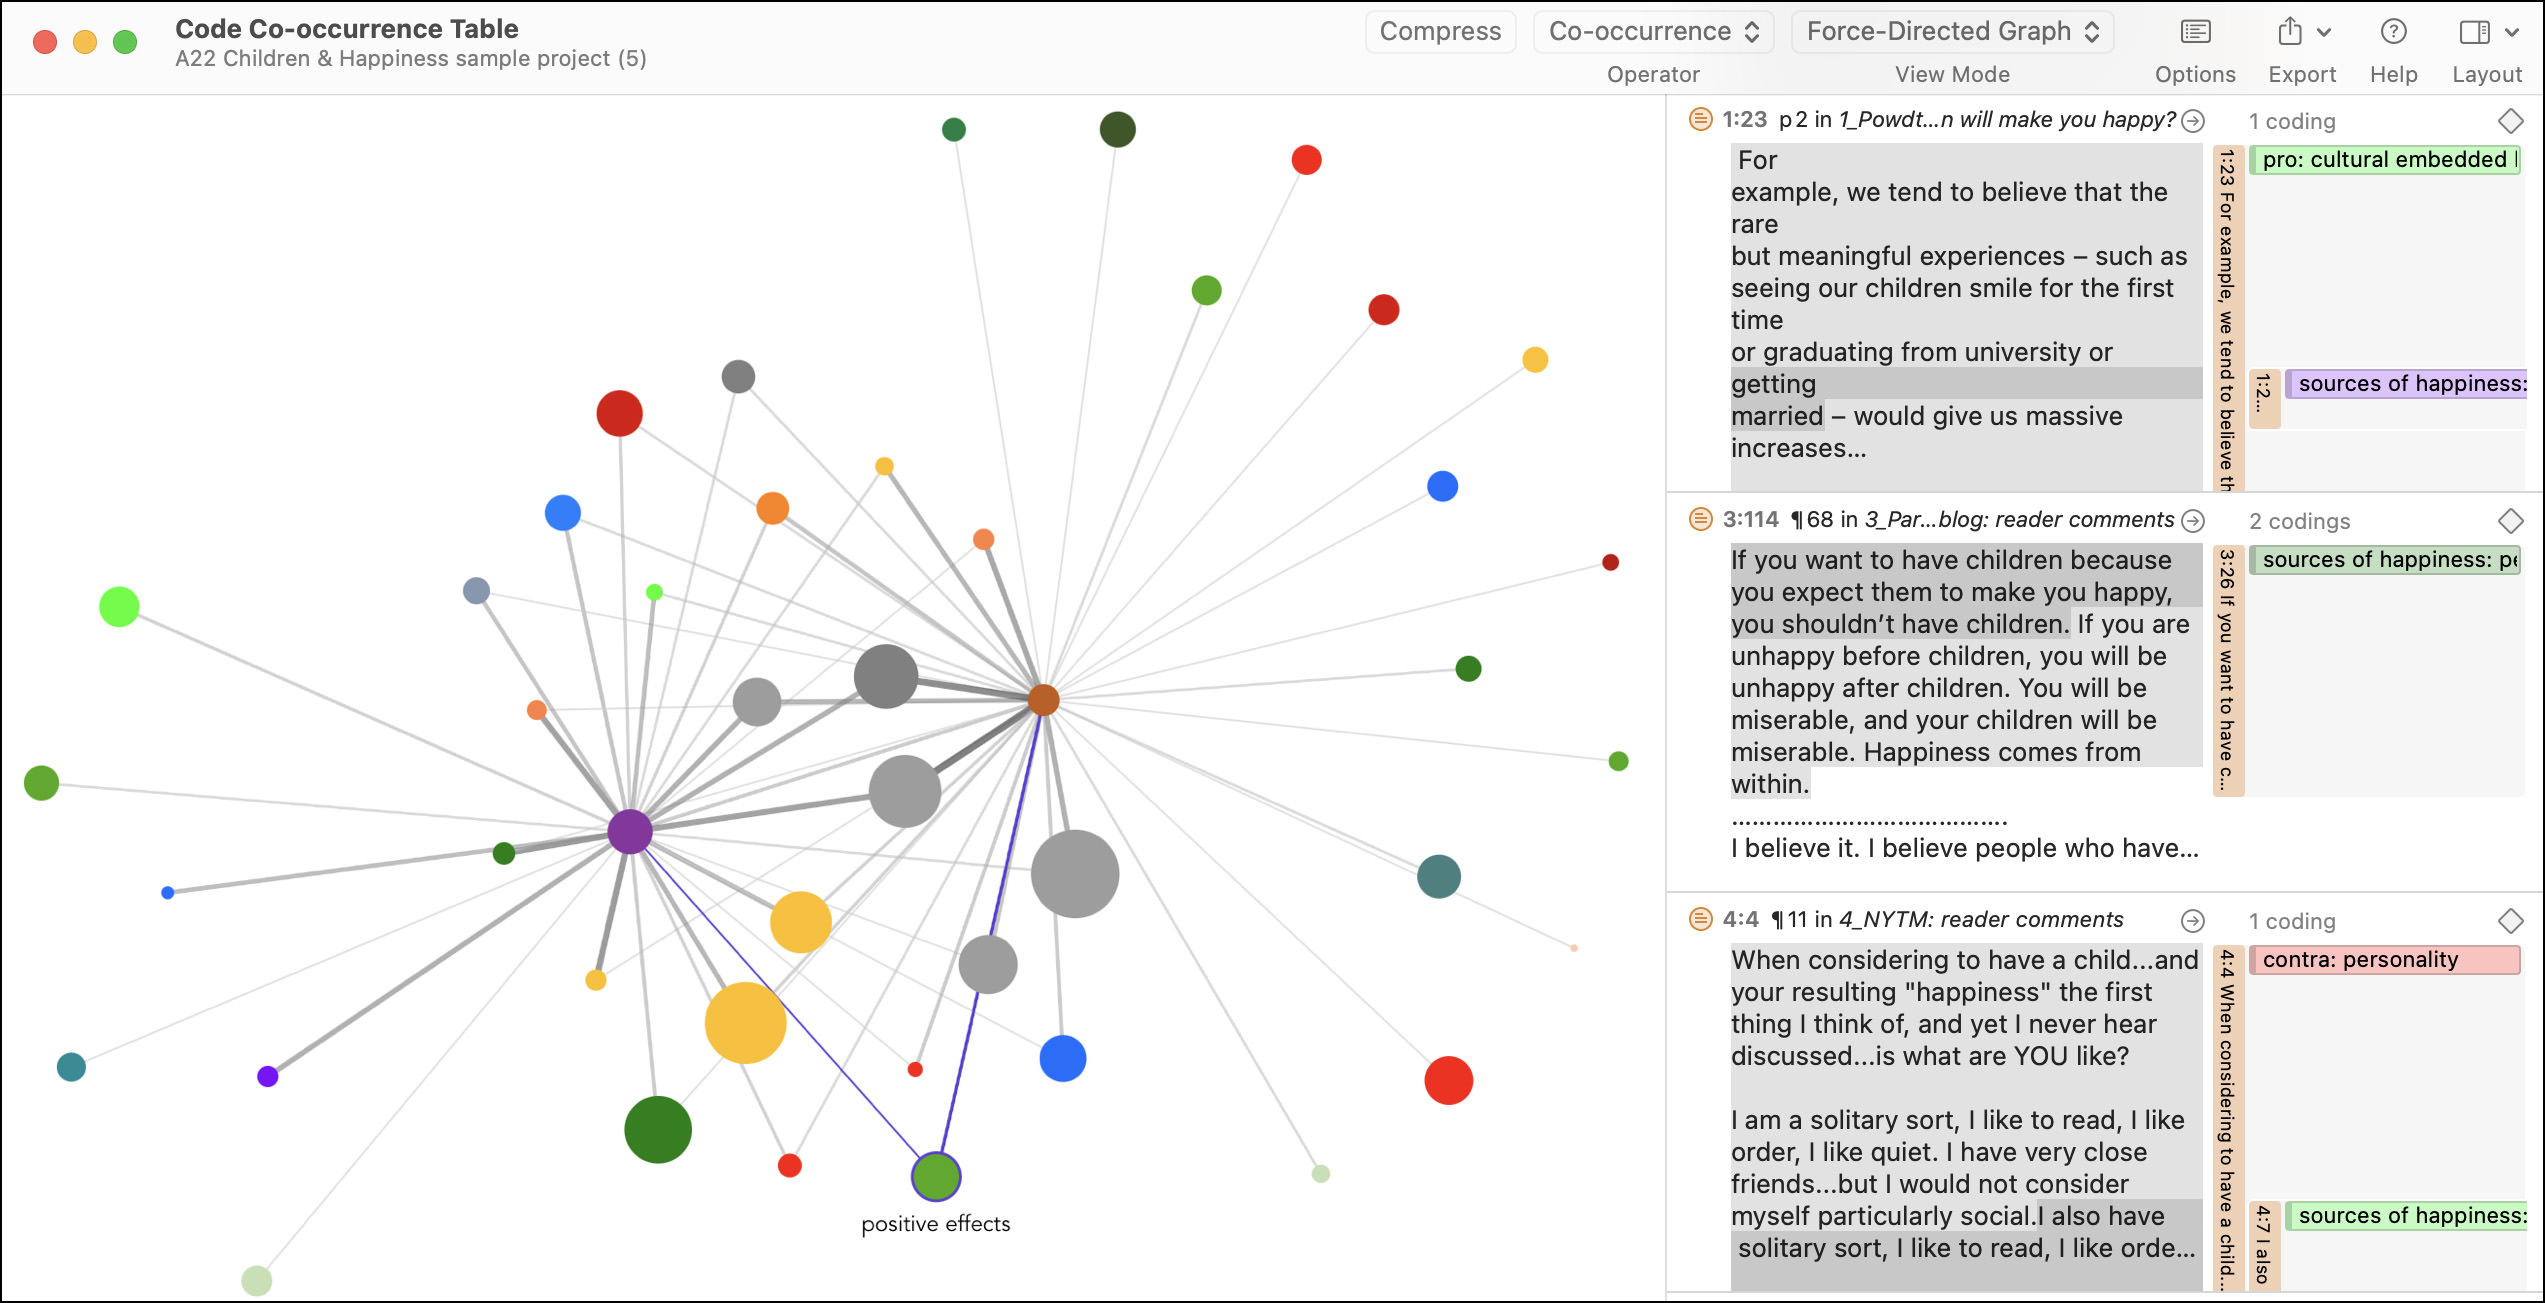
ATLAS.ti & OpenAI. Gain qualitative insights in minutes instead of weeks! Complete your research projects up to 10x faster with the power of OpenAI. Experience full coding on autopilot as well as automatic summaries and get real-time code suggestions.
Analyze what you want, the way you want. ATLAS.ti removes the headache from qualitative data analysis and lets the software do the heavy lifting. Generate deep insights automatically, leveraging the latest AI and machine learning algorithms for faster results.
2. XLSTAT
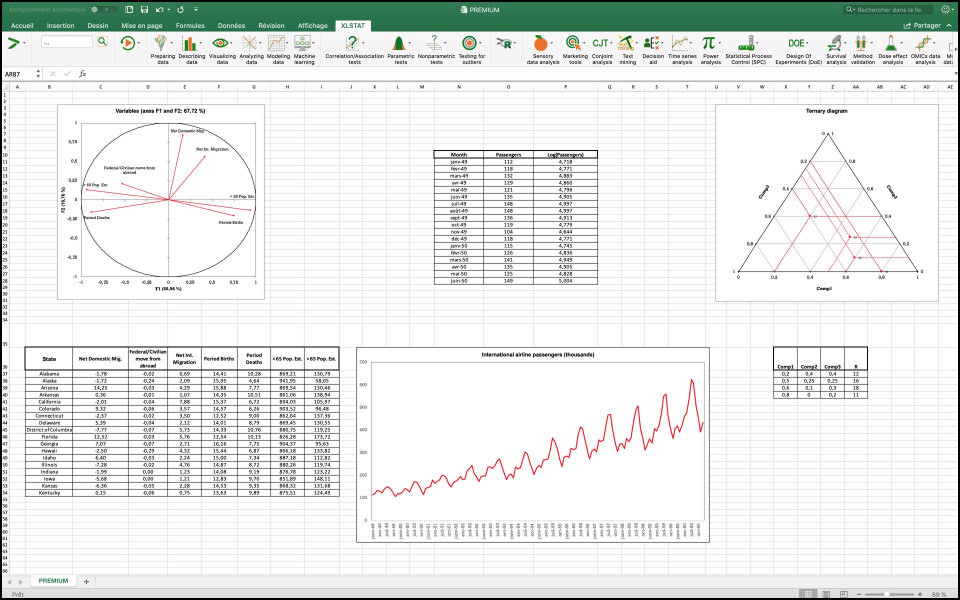
XLSTAT is a powerful yet flexible Excel data analysis add-on that allows 150,000+ users in over 120 countries across the world to analyze, customize, and share results within Microsoft Excel. With XLSTAT’s advanced PROCESS, EEMD, Time Series, MFA, and Semantic Chart features, you can test mediation and moderation hypotheses, perform advanced time series analyses, and improve the quality of your visualizations.
3. Phocas Software
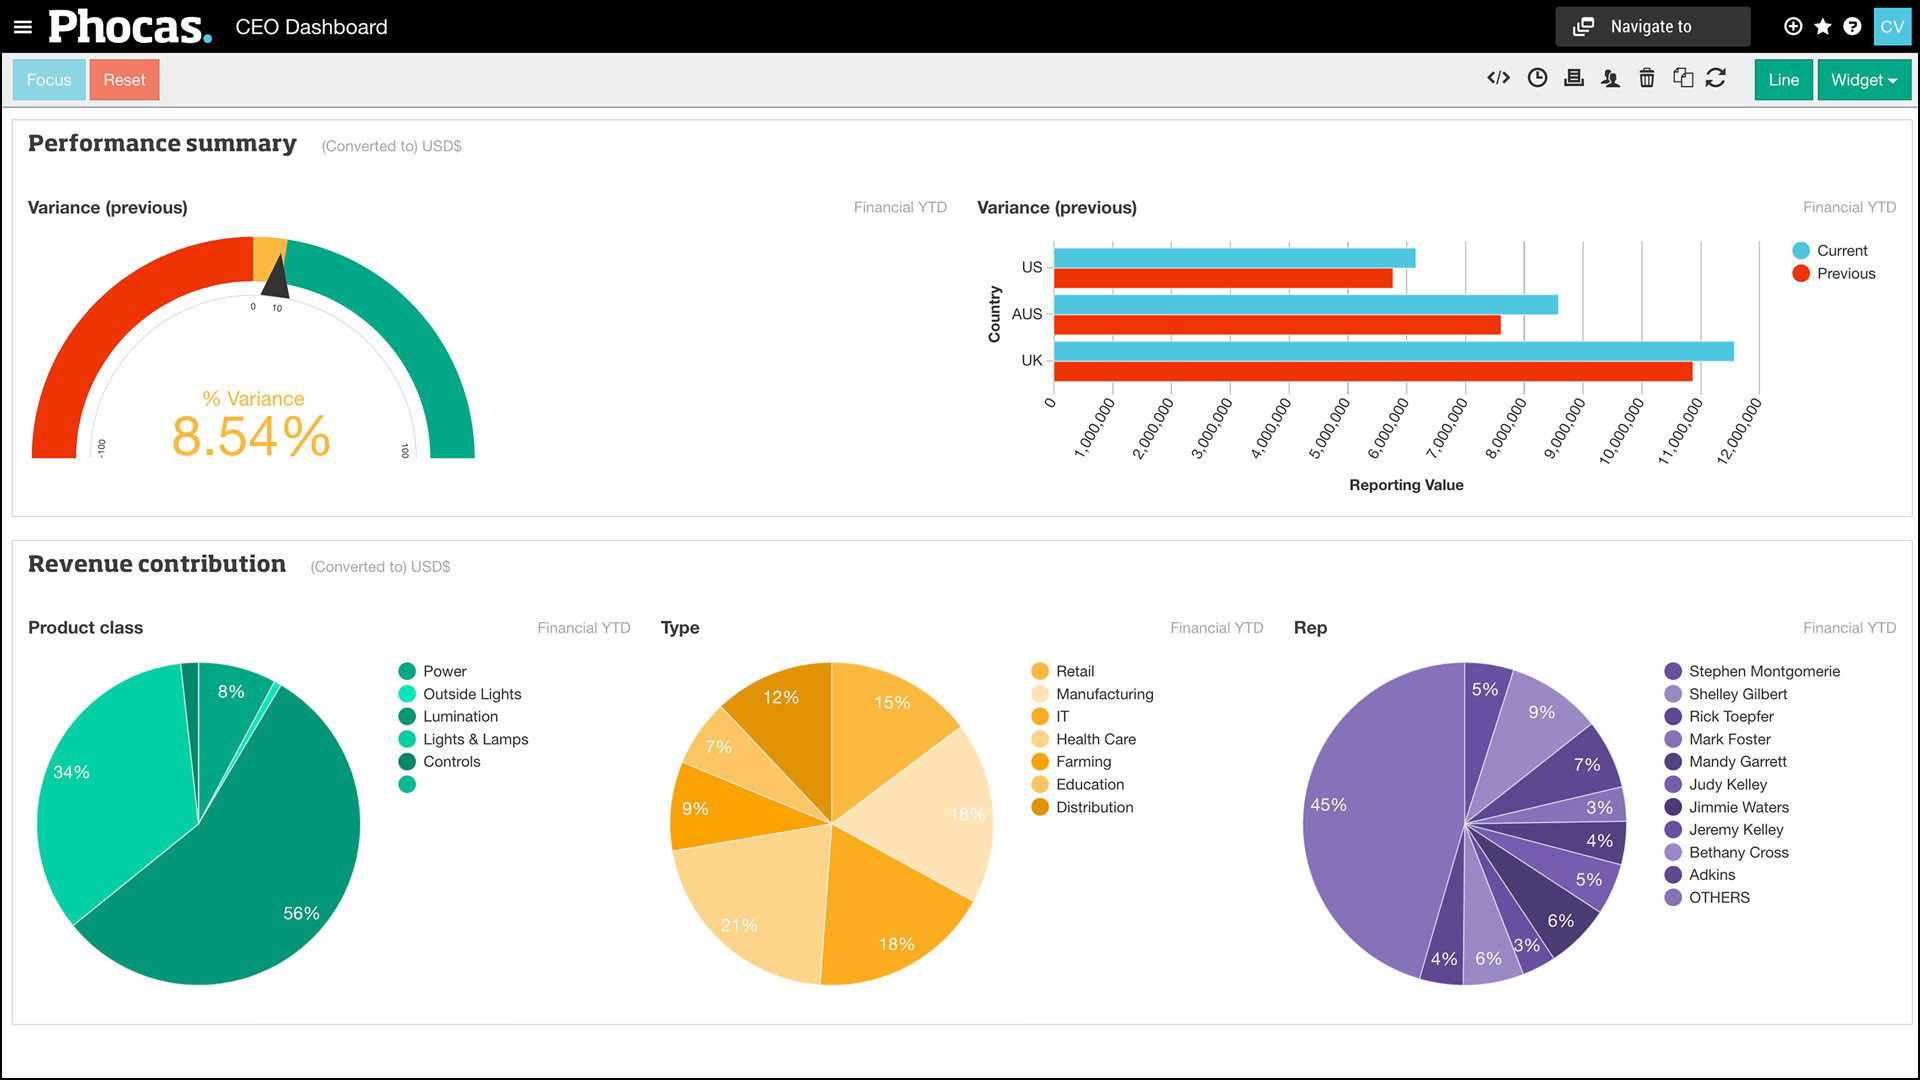
Management, finance, sales and operations – all on the same page with the numbers that make your business tick. Phocas is a team of passionate professionals who are committed to helping people feel good about their data. Their software brings together organizations’ most useful data from an ERP and other business systems and presents it in a way that makes it easy to analyze by anyone.
Phocas gives you better visibility to best serve customers and more financial control. No more waiting for changes and reports so you can get on with making smart moves today and planning a more certain future for your business. Solutions:
- Business planning
- Performance management
- Sales analytics
- Financial planning and analysis
- Operational efficiency
- Secure data integration
4. Displayr
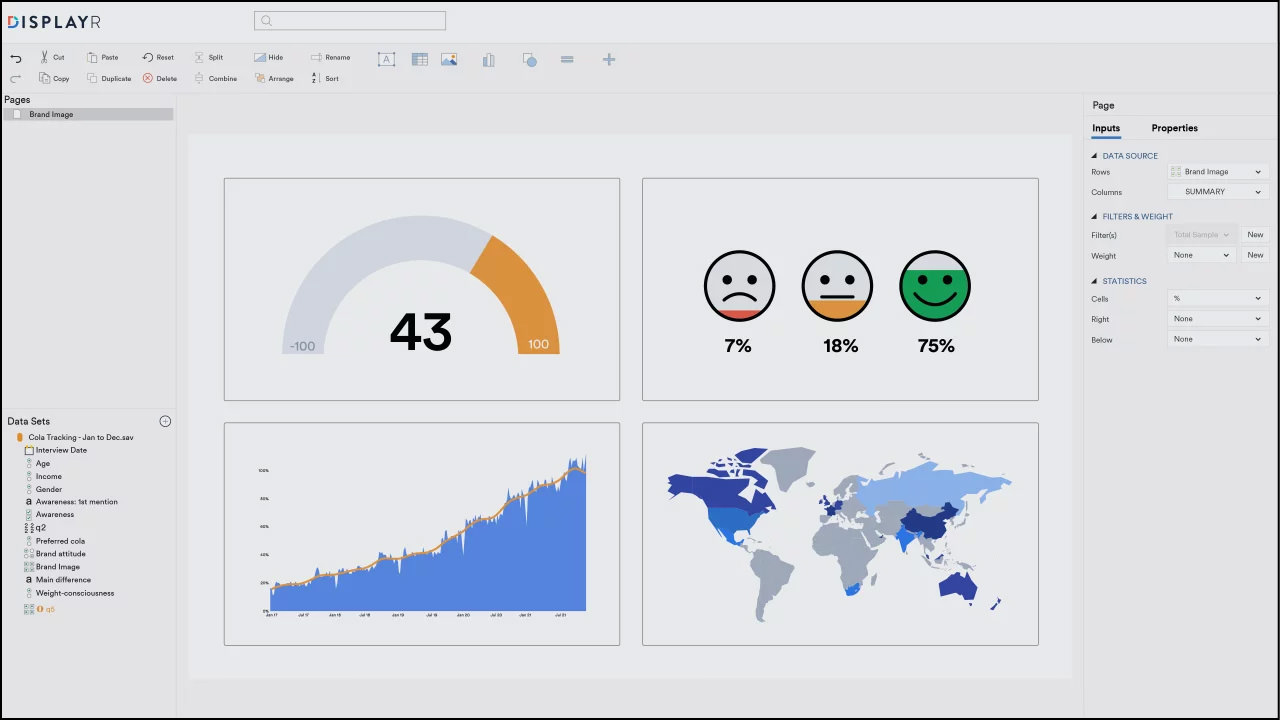
Displayr is all-in-one analysis and reporting software purpose-built for survey data. Displayr is a cloud-based reporting and analysis management solution that enables organizations to capture data from different sources, generate analytics and manage data visualization operations via a unified portal.
The only tool to quickly uncover and share the stories in your survey data. Easy for the novice, powerful for the expert. Analyze, report and publish dashboards. Purpose-built for survey data. Automatically update everything with new data. Everything’s reproducible, Work collaboratively in real time. Secure cloud platform. Nothing’s missing.
- All analysis techniques are built-in – Everything you’ll ever need including regression, PCA, clustering, latent class analysis, machine learning, MaxDiff, conjoint, TURF, and so much more.
- Any report exports to PowerPoint – Automatically update entire PowerPoint reports with new data (e.g., waves of survey data, country level reports, automatically batch export).
Automate all the painful, time consuming, and repetitive analysis and reporting tasks you used to do manually. Displayr includes collaboration functionality, which enables members across teams to create and edit documents and export them into PowerPoint, Excel or PDF files for sharing. Whatever you do, you can do it in Displayr
- Dashboarding
- Automatic Updating
- New Product Development
- Tracking Analysis
- PowerPoint Reporting
- Customer Feedback
- Data Visualization
- Segmentation
- Brand Analytics
- Pricing Research
- Survey Analysis
- Data Stories
- Advertising Research
- Data Cleaning
- Driver Analysis
- Statistical Testing
- Factor Analysis
- Regression
- Correspondence Analysis
- Cluster & Latent Class
- Text Analysis
- MaxDiff
- Conjoint
- Crosstabs
- TURF
- Weighting
5. Alteryx
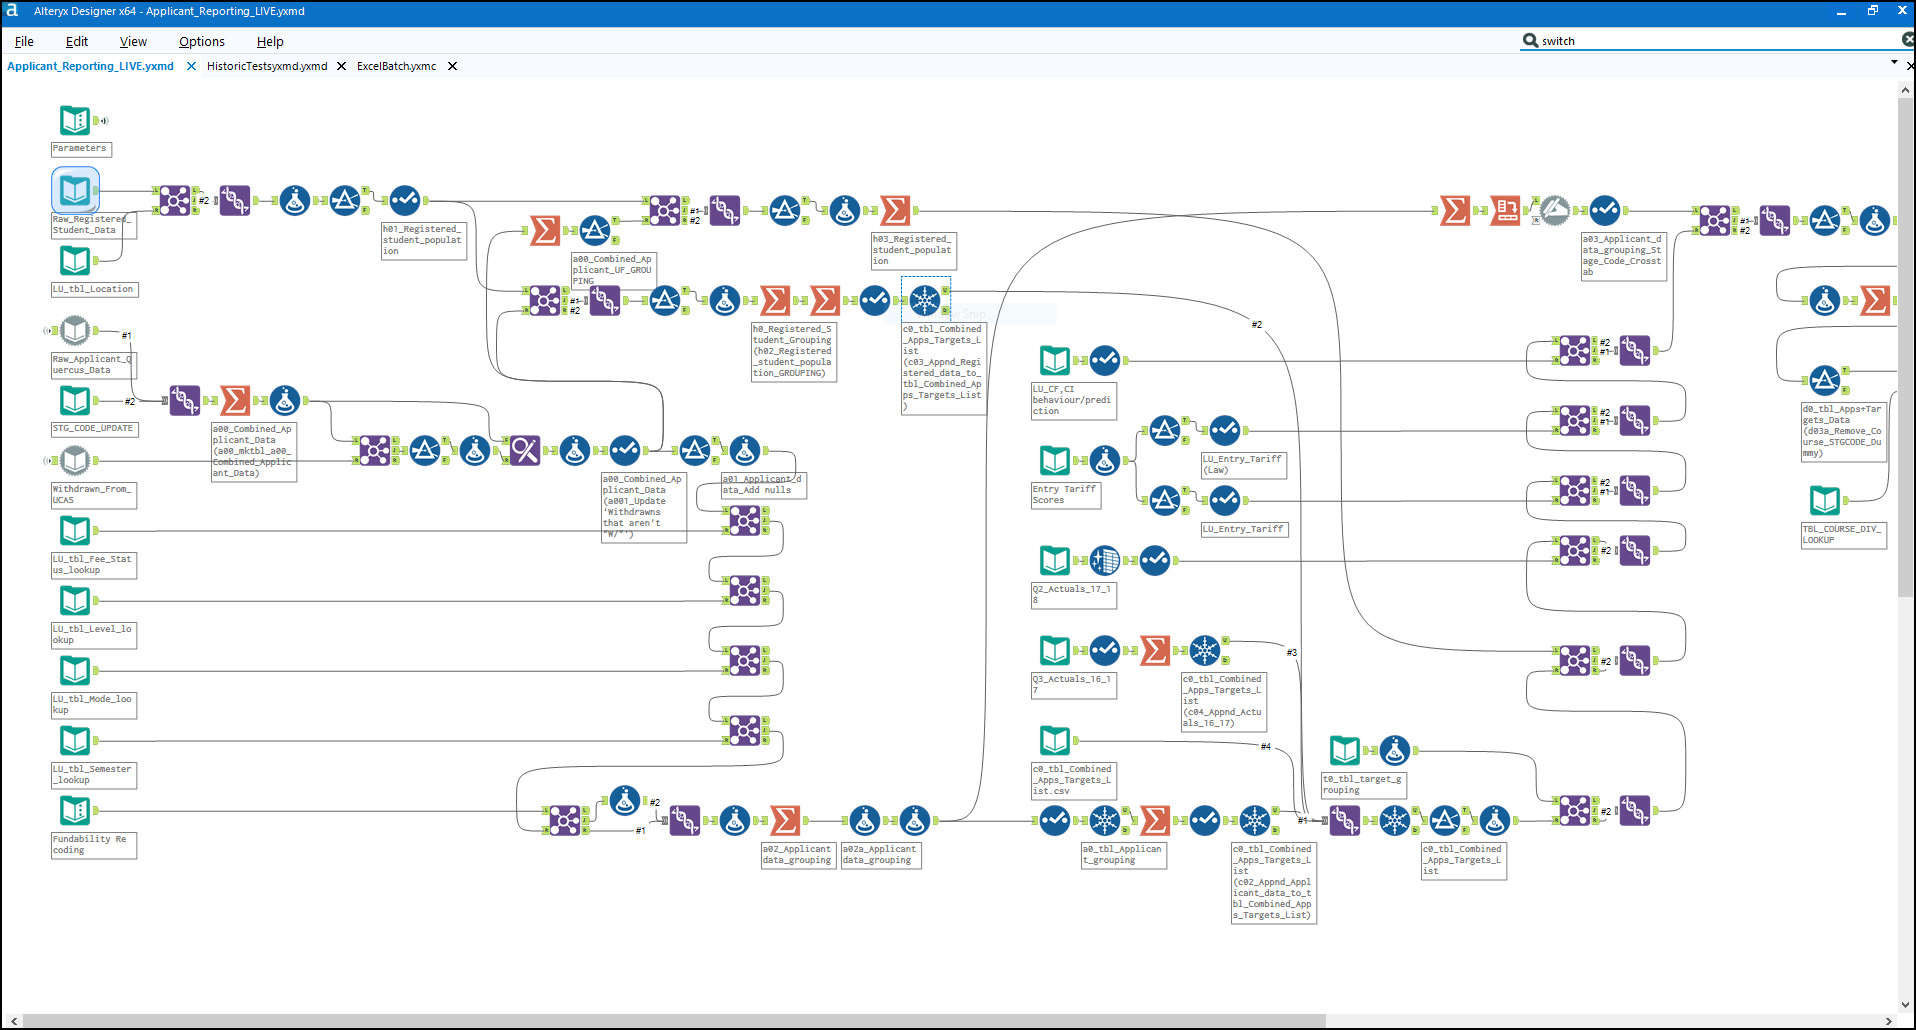
Alteryx is the launchpad for automation breakthroughs. Be it your personal growth, achieving transformative digital outcomes, or rapid innovation, the results are unparalleled. Drive business value at scale by empowering everyone to generate insights from data. Alteryx is enterprise-ready so you can be ready for anything.
Shift from spreadsheet-driven data processes to repeatable, automated analysis and insights for tax, audit, accounting, treasury, and financial planning. Build resiliency by automating data across your supply chain to gain speed, granularity, and transparency. Deliver the data and analysis the business needs without long integration or metric development processes.
- Financial Services – Manage compliance, mitigate risk, gain deeper customer insight, and improve operational efficiency for higher margins.
- CPG/Retail – Develop deeper insights into demand to improve outcomes within the supply chain and across the customer experience.
- Healthcare – Create a unified picture of patient and healthcare operations to improve your business, clinical, and patient outcomes.
- Public Sector – Serve people better, accelerate outcomes, and crush your department’s mission with analytics that drive more actionable insights.
- Manufacturing – Maximize production of goods across manufacturing to ensure quality, reduce costs, and optimize supply chains.
- Higher Education – Accelerate learning with analytics to improve student retention, elevate alumni engagement, and transform academic success.
- Oil & Gas – Explore, understand, and optimize efficiencies in upstream, midstream, and downstream operations.
6. OriginPro
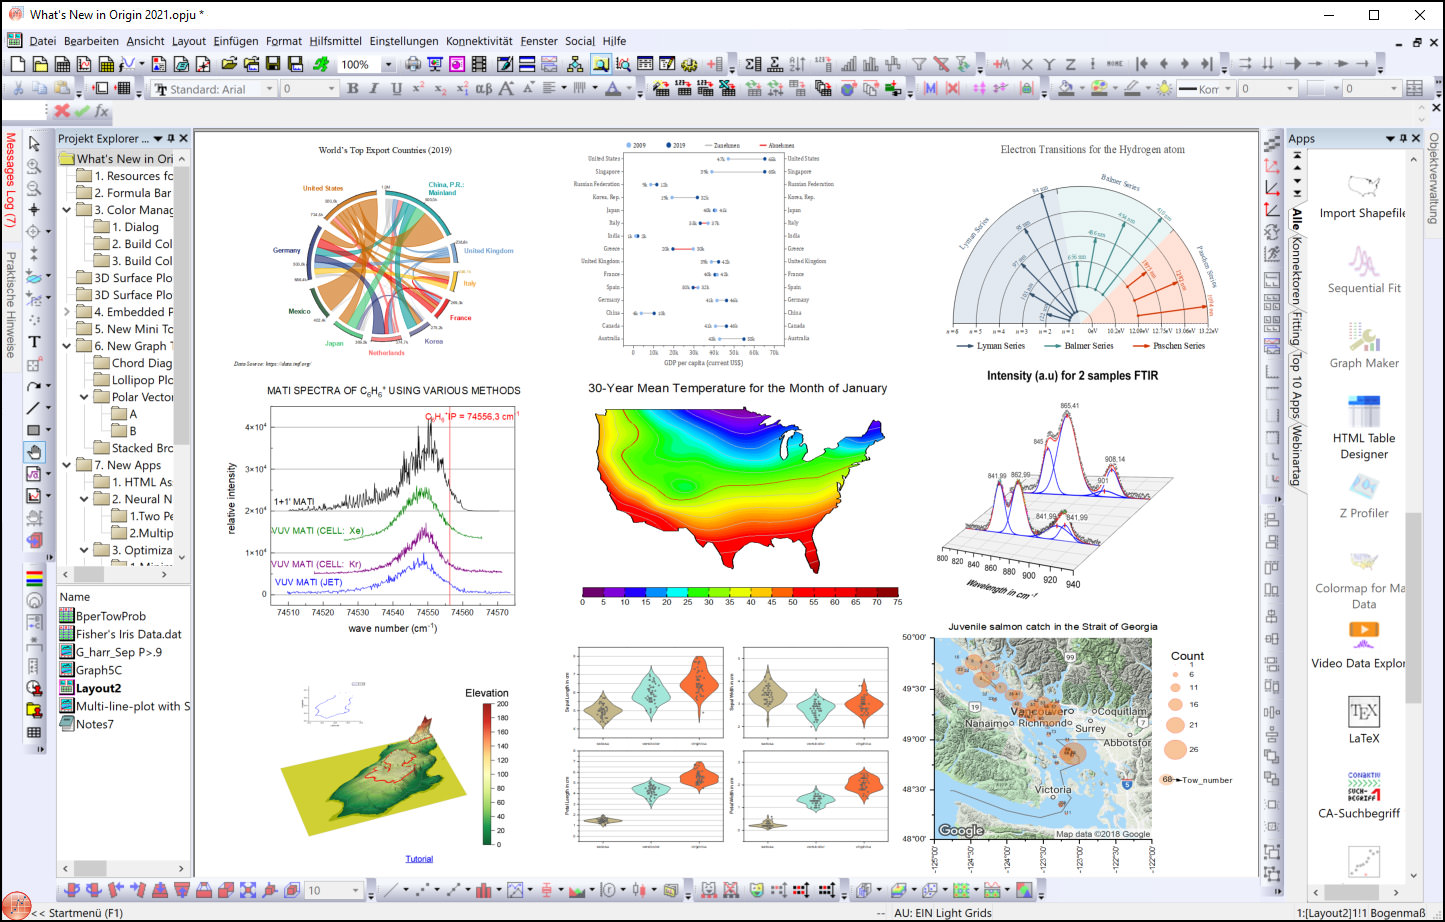
Origin is the data analysis and graphing software of choice for over half a million scientists and engineers in commercial industries, academia, and government laboratories worldwide. Origin offers an easy-to-use interface for beginners, combined with the ability to perform advanced customization as you become more familiar with the application.
Origin graphs and analysis results can automatically update on data or parameter change, allowing you to create templates for repetitive tasks or to perform batch operations from the user interface, without the need for programming. Extend the capabilities in Origin by installing free Apps available from their website. Connect with other applications such as MATLAB™, LabVIEW™ or Microsoft© Excel, or create custom routines within Origin using their scripting and C languages, embedded Python, or the R console. Examples using Origin for discipline-specific applications are available in these areas:
- Chemistry
- Neuroscience
- Pharmacology
- Spectroscopy
- Test & Measurement
7. SAP Analytics Cloud
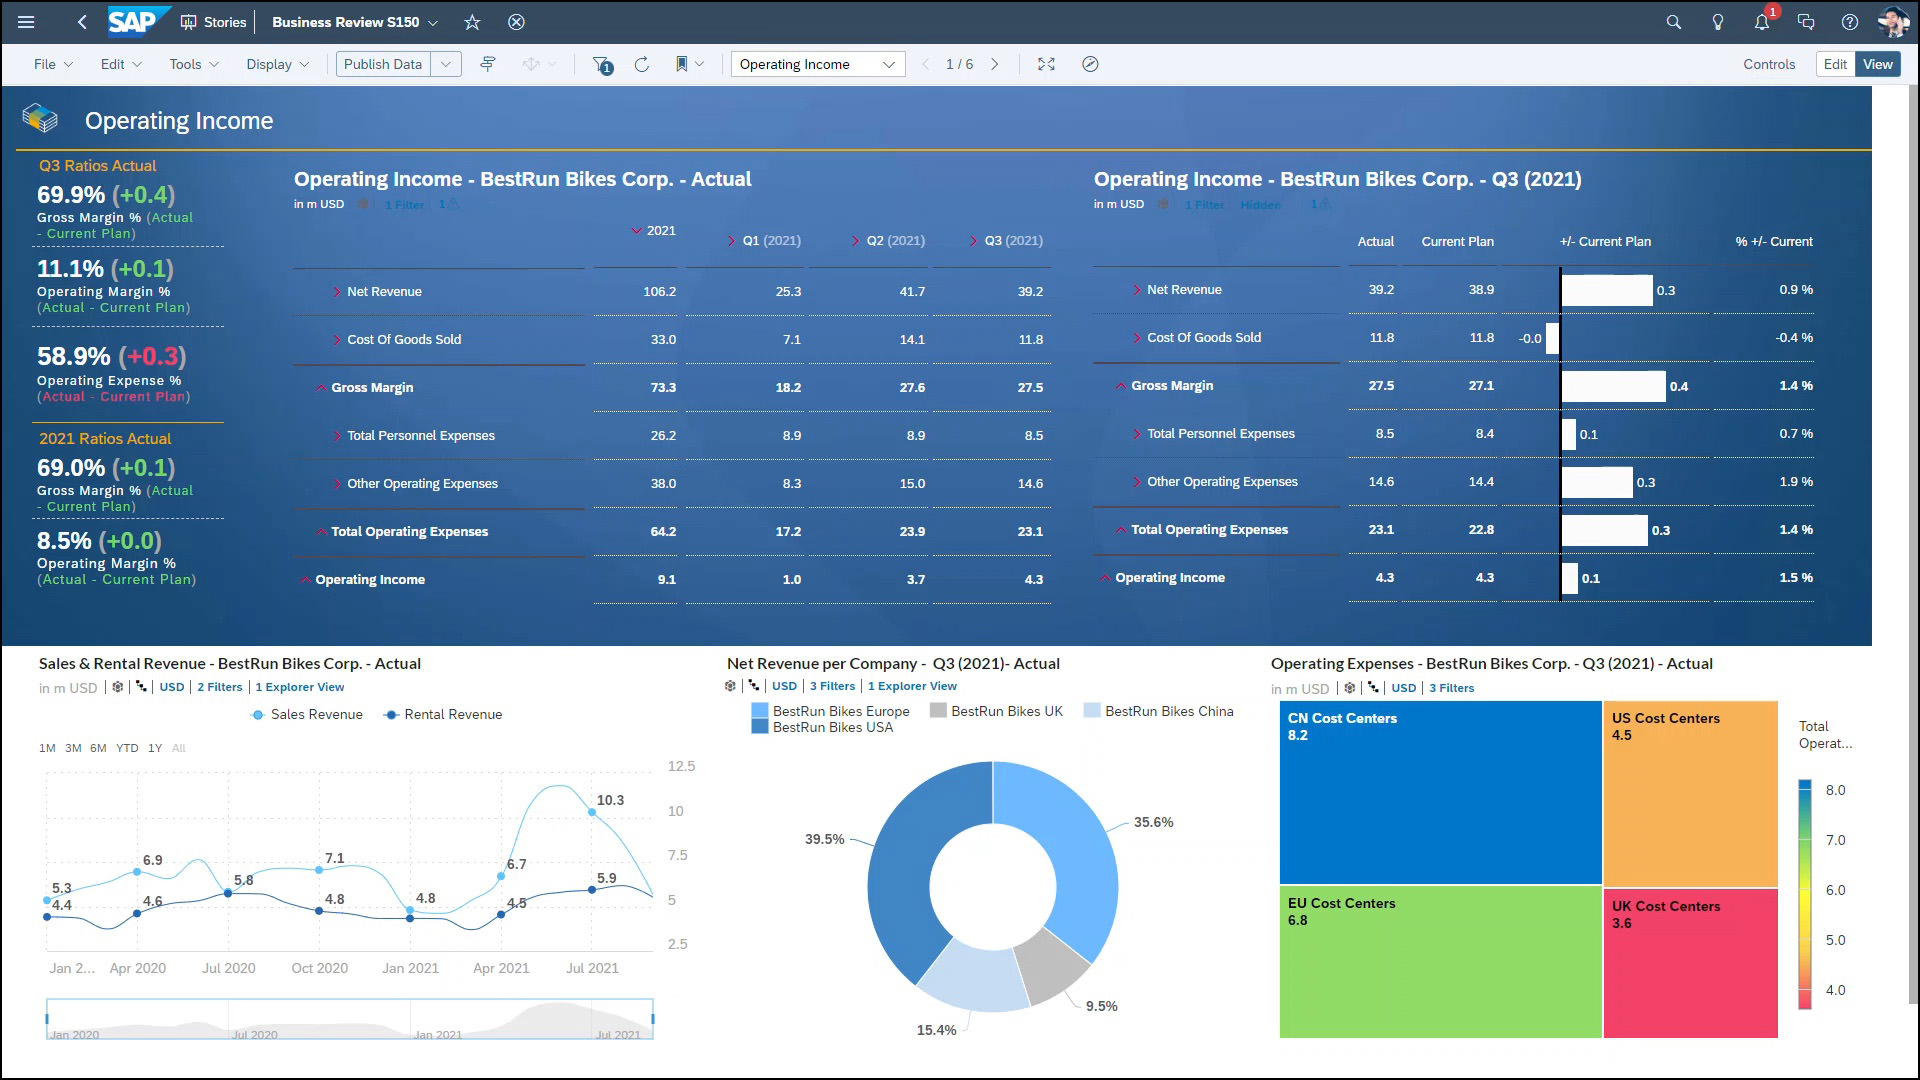
With the SAP Analytics Cloud solution, you can bring together analytics and planning with unique integration to SAP applications and smooth access to heterogeneous data sources. As the analytics and planning solution within SAP Business Technology Platform, SAP Analytics Cloud supports trusted insights and integrated planning processes enterprise-wide to help you make decisions without doubt.
- All in one application – Deliver timely plans, budgets, forecasts, and reports with greater speed and accuracy with a full set of enterprise planning features at your fingertips.
- Data-driven decisions – Make end-to-end decisions across the business in real-time with built-in business intelligence and analytics.
- Gain intelligent, trusted insights – Automate forecasts at any level of your plans to save time and gain trusted results with predictive analytics and machine learning.
- Model situations immediately – Simulate multiple outcomes to see the impact of your business drivers in a sandbox environment. Use private versions to collaborate with teams on what-if analysis.
- Crowdsource plans across departments – Share and discuss plan across the business with built-in collaboration features. Leverage dynamic workflows for increased accountability and discuss on-the-go with the mobile application.
- Create seamless planning workflows – Use the powerful calendar feature to create scheduled tasks, workflows, and allocations to streamline your planning processes. The built-in multi-step planning processes allow you to trigger actions across departments, cost centers and versions.
8. Minitab
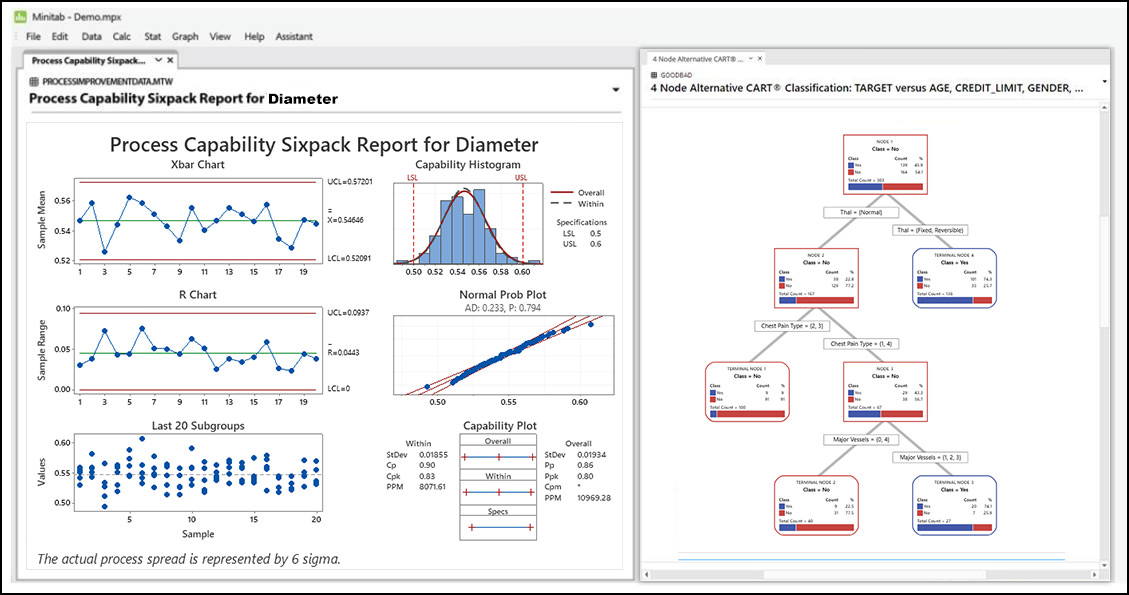
Visualize, analyze, and harness the power of your data to solve your toughest business challenges from anywhere on the cloud. Data is everywhere, but are you truly taking advantage of yours? Minitab Statistical Software can look at current and past data to discover trends, find and predict patterns, uncover hidden relationships between variables, and create stunning visualizations to tackle even the most daunting challenges and opportunities.
With powerful statistics, industry-leading data analytics, and dynamic visualizations on your side, the possibilities are endless. Using t-tests, one and two proportions hypothesis, normality tests, chi-square and equivalence tests, professionals can generate improved processes for designing products. Minitab enables data scientists to forecast business results through classification and regression Trees (CART) logistic regression, factor analysis and cluster variables.
9. Microsoft Power BI
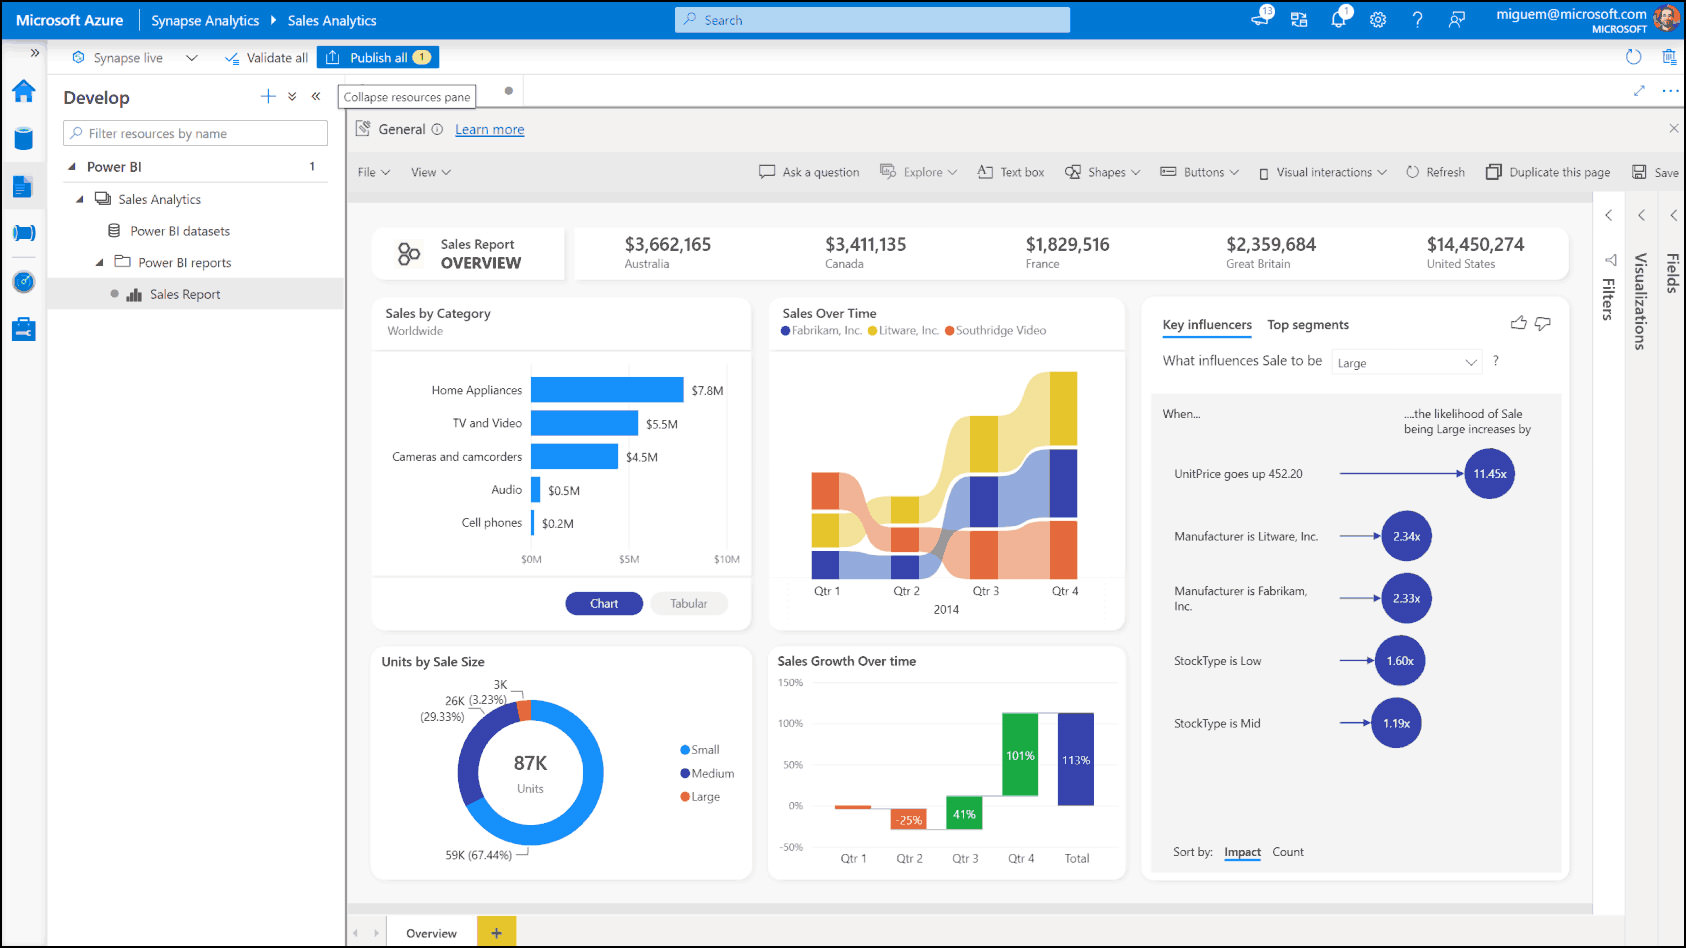
Microsoft Power BI is a web-based business analytics and data visualization platform that is suitable for businesses of all sizes. It monitors important organizational data and also from all apps used by organizations. Microsoft Power BI provides tools to quickly analyze, transform and visualize data, and also share reports.
Uncover the full potential of your data using next-generation AI tools with Copilot in Power BI. Describe the insights you need or ask a question about your data and Copilot analyzes and pulls the right data into a report—easily turning data into actionable insights.
Connect and analyze your entire data estate by combining Power BI with Azure analytics services—including Azure Synapse Analytics and Azure Data Lake Storage. Analyze petabytes of data, use advanced AI capabilities, apply additional data protection, and more easily share insights across your organization.
10. Zoho Analytics
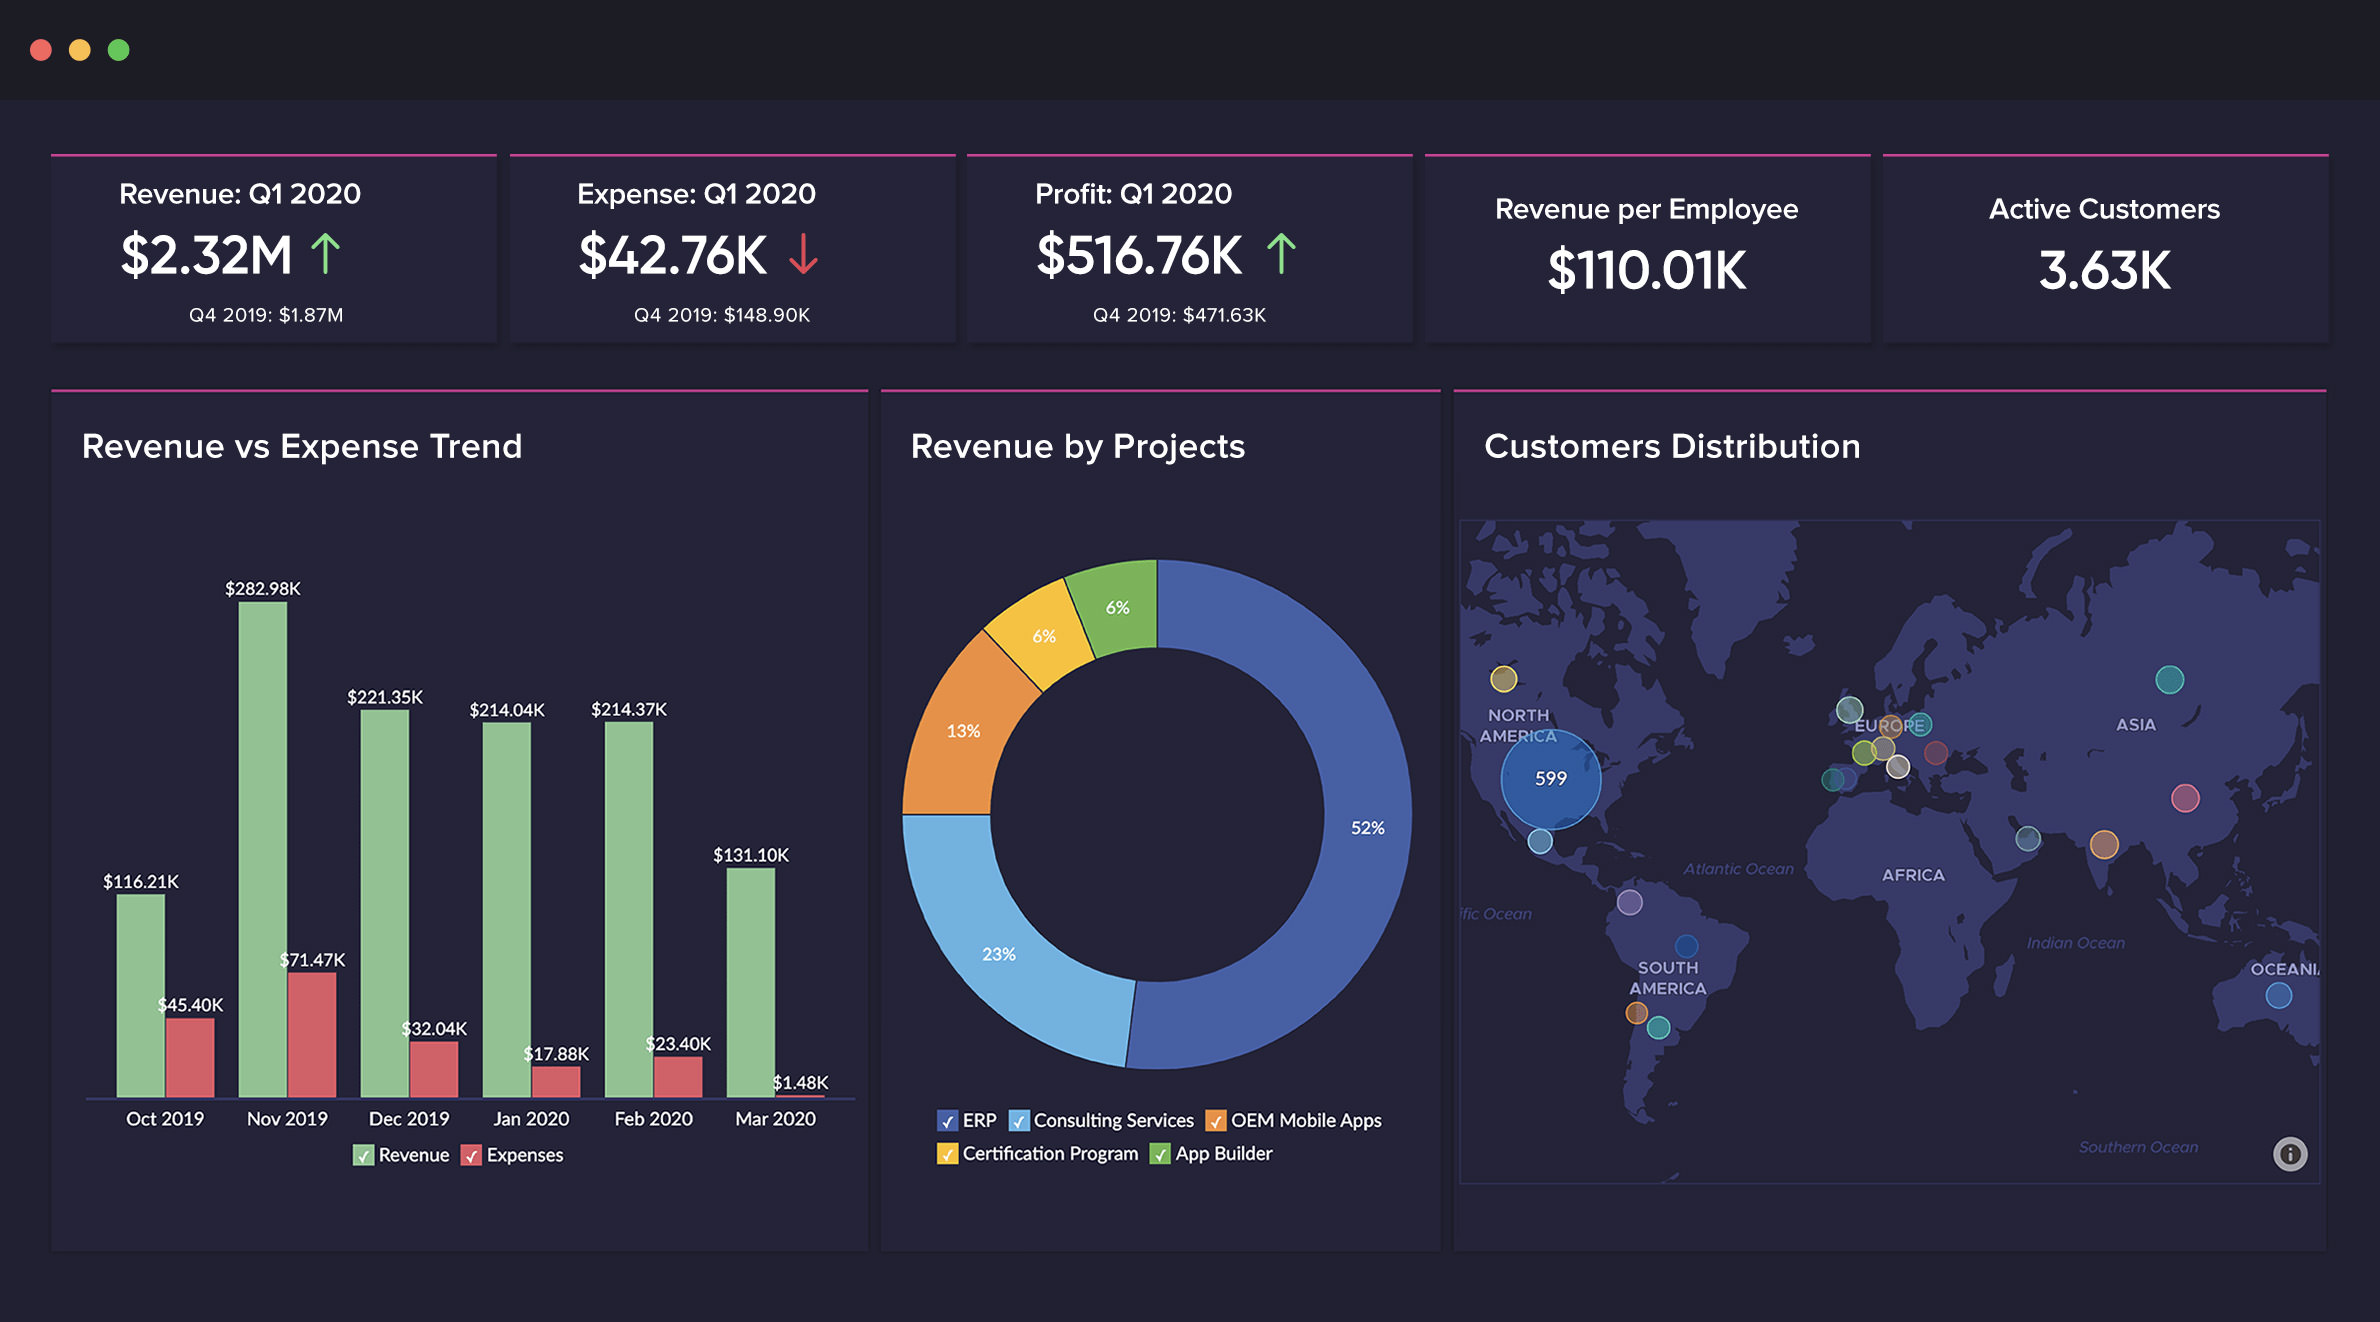
Zoho Analytics helps business users connect, prepare and analyze their data, create stunning data visualizations, and discover hidden insights, all within minutes. Zoho Analytics is a cloud-based reporting and business intelligence solution that offers several applications within its suite, including dashboards, analysis, reporting, data warehousing and more.
- Data Integration – Get your data analyzed, wherever it is, from over 250+ datasources. Connect to data from files, feeds, web URLs, databases, business apps, and more.
- Data Preparation & Management – Use their self-service data preparation and management app Zoho DataPrep seamlessly within Zoho Analytics. Get your raw data cleansed, transformed, and enriched, for easier and better analysis.
- Visual Analysis – Slice and dice your data, and analyze it visually using a variety of visualization tools.
- Augmented Analytics – Augment your analysis of data with technologies like artificial intelligence (AI), machine learning (ML), natural language processing and generation (NLP/G), and get quick insights from your data.
- Unified Business Insights – Unify business data across your organization from various functions like marketing, sales, support, finance etc. Seamlessly analyze this unified data and unearth end-to-end insights.
- Collaborative Analytics – Make collaboration as a part of your data analytics. Democratize data, enable pervasive BI and analytics in your organization.
- Data Storytelling – Tell engrossing stories with your data. Present/publish analytical insights in the context of familiar business workflows.
- Mobility – Access, and interact with your data, reports, and dashboards from phones and tablets.
- Security & Governance – Zoho Analytics is governed by strong Zoho Security Practices, including support for redundancy, backup, confidentiality and privacy, to help ensure your data is secure and safe.
- Deployments – Deploy Zoho Analytics according to your needs. Subscribe to Zoho Analytics cloud, or install it on-premise in your own servers. Or deploy it in public clouds like AWS, Azure, Google. Or use the white labeled version.
11. Qlik Sense
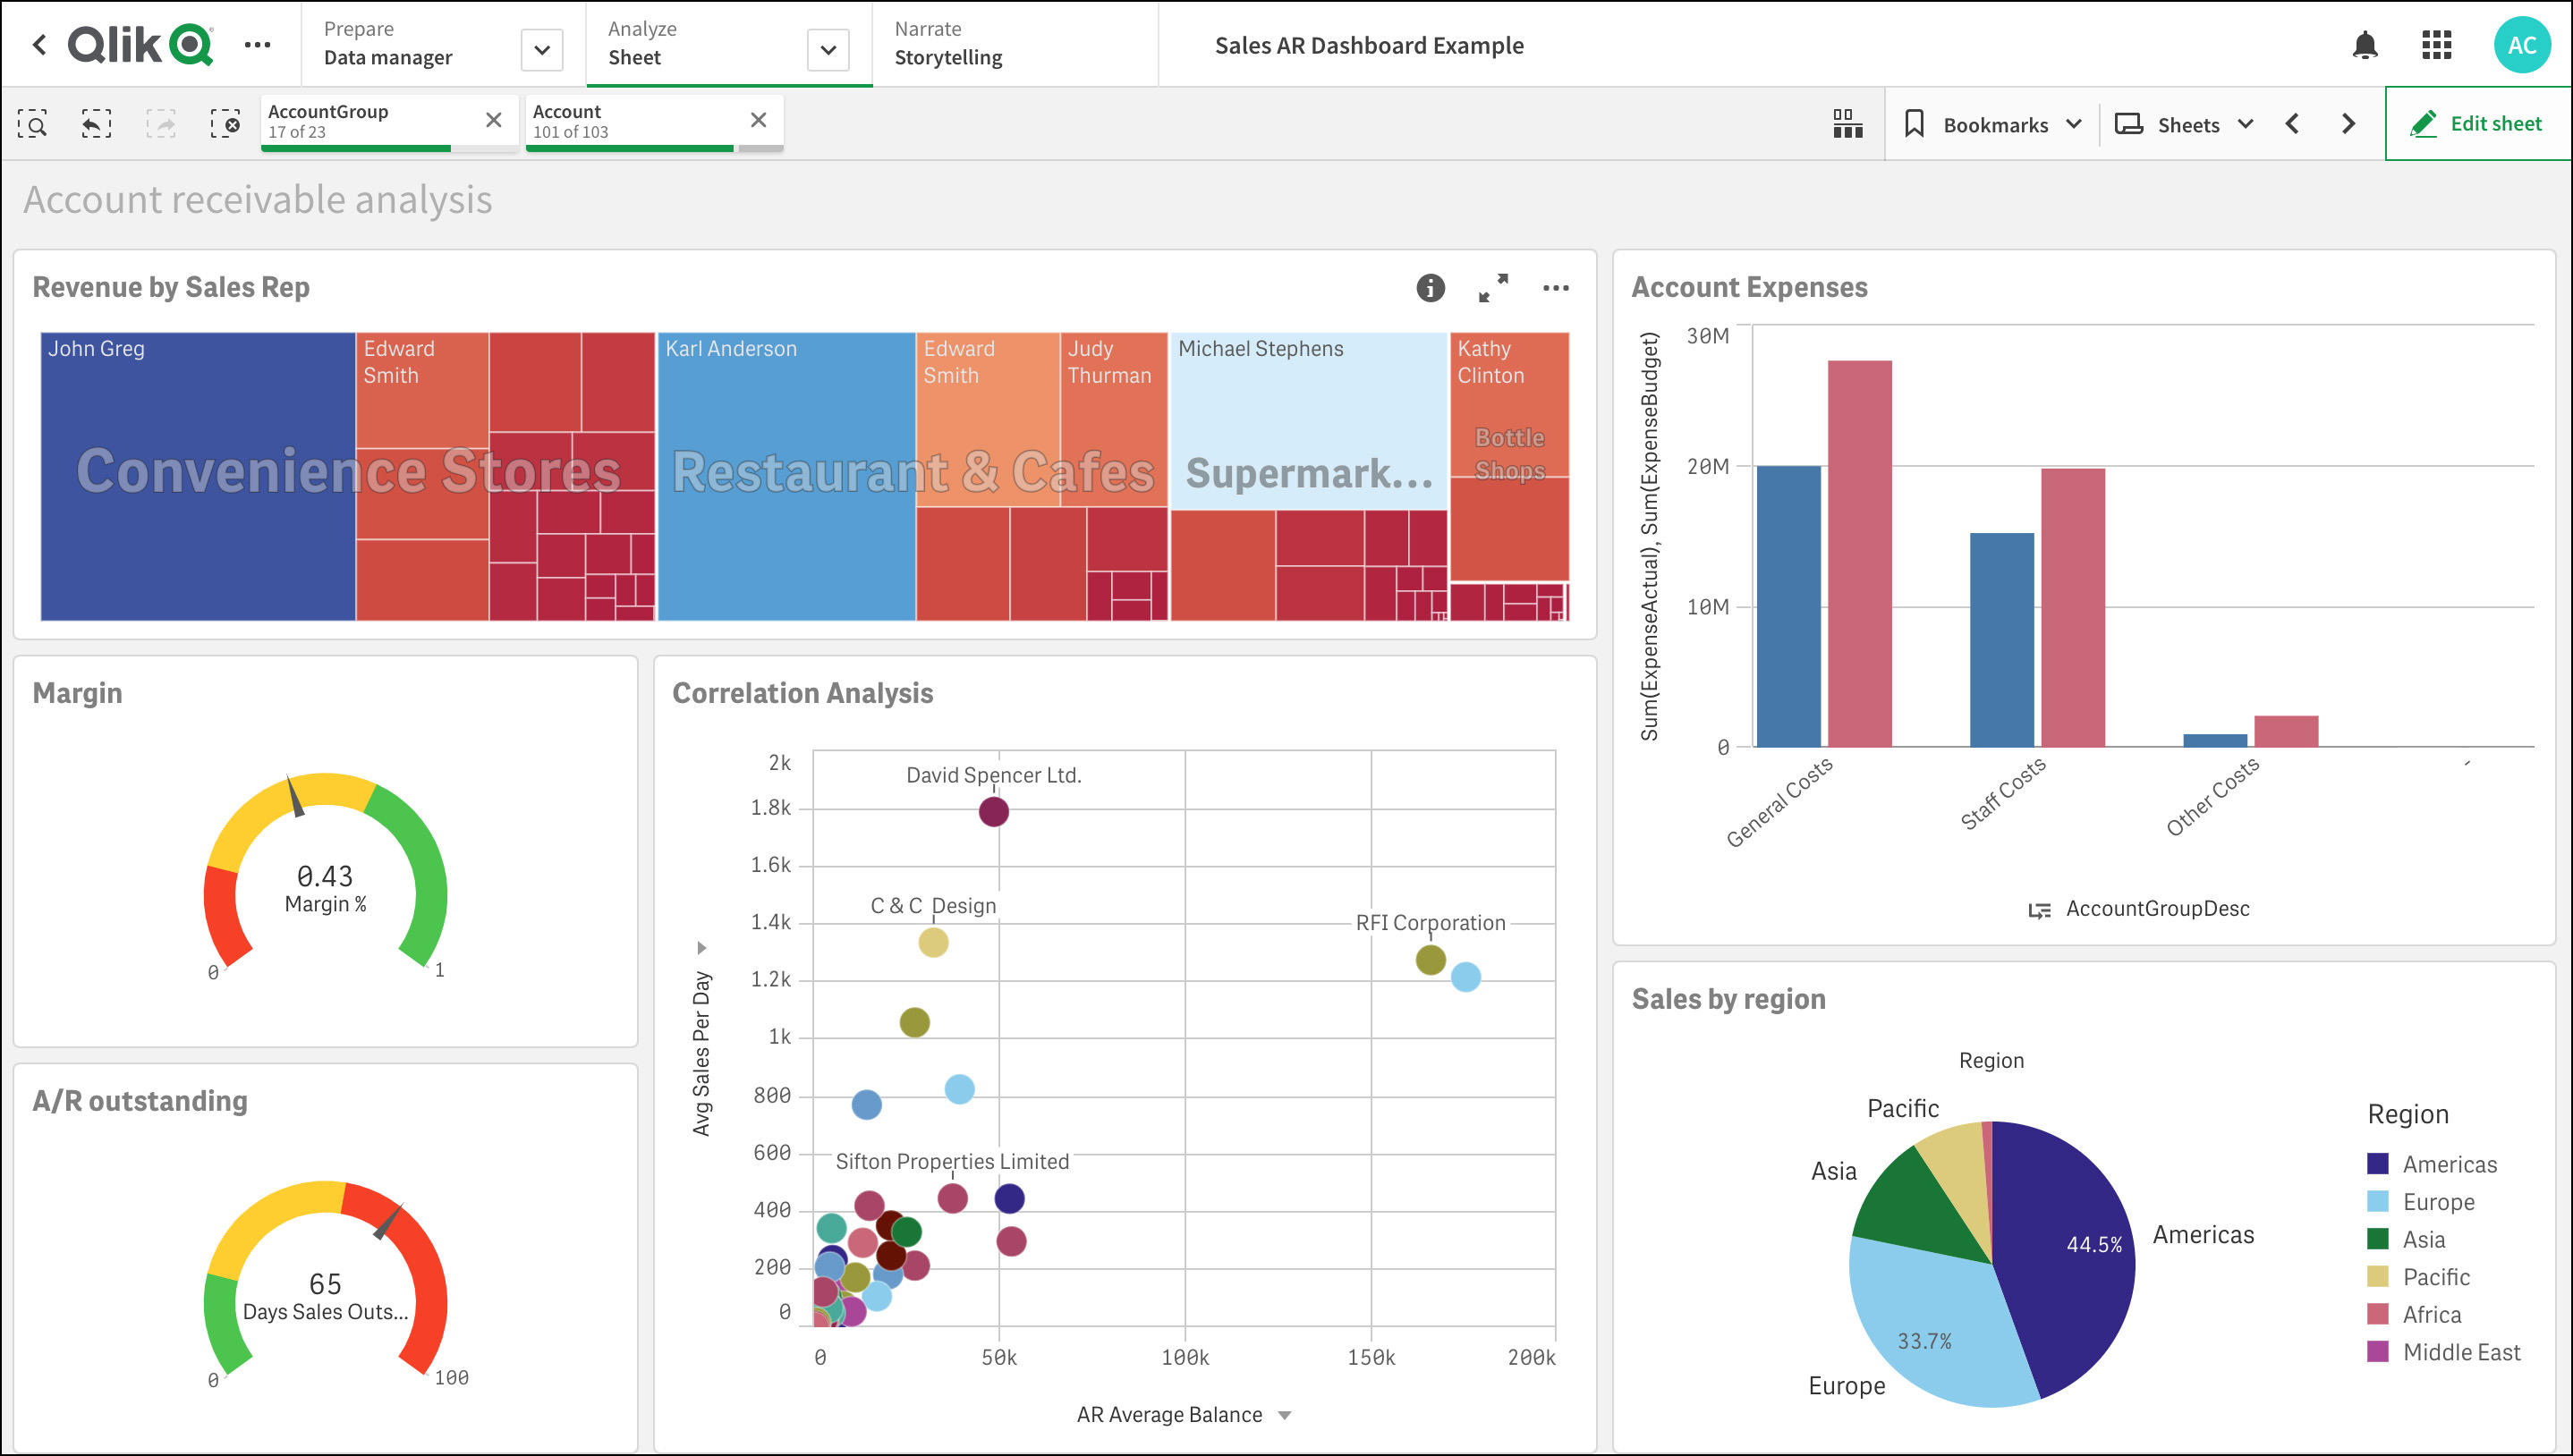
Empower people at all skill levels with AI-assisted insights and predictions that inform intelligent action when it matters most. Qlik’s one-of-a-kind Associative technology brings unmatched power to the core of their industry-leading analytics experience. Empower all your users to explore freely at the speed of thought with hyperfast calculations, always in context, at scale.
Qlik Sense uses AI to help your users understand and use data more effectively, minimizing cognitive bias, amplifying discovery, and elevating data literacy. Get analytics with a full range of augmented capabilities:
- AI-generated analyses and insights
- Automated creation and data prep
- Search and natural language interaction
- Machine learning & predictive analytics
12. Adobe Analytics
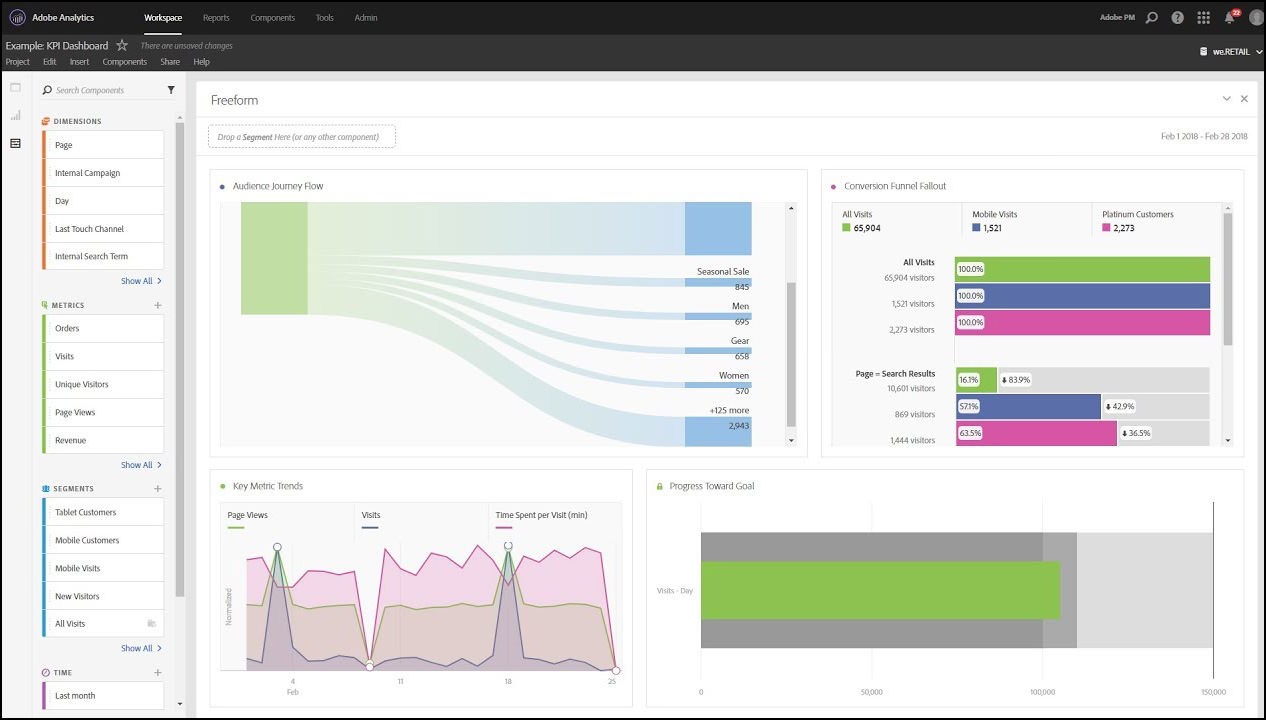
Adobe Analytics lets you mix, match, and analyze data from any digital point in the customer journey. With in-depth analysis, versatile reporting, and predictive intelligence, you get the insightful foundation you need to build better customer experiences.
Adobe Analytics helps you piece together digital data to capture a richer customer story you can quickly act on. From understanding attribution to customized reporting, get the predictive intelligence you need to elevate your customer experiences.
- Multichannel data collection – Their open measurement protocol can capture data from virtually any source (i.e., voice, video, audio, connected car, IoT, CRM, Intranet, etc.) Or, use their data collection library for Javascript and mobile app SDKs.
- Offline data integration – Integrate data from a CRM system or any other source of online or offline enterprise data (e.g., loyalty program levels) as an added analysis dimension.
- Ad hoc analysis – With their Analysis Workspace feature, you get a robust, flexible canvas for building custom analysis projects. Drag and drop any number of data tables, visualizations, and components (channels, dimensions, metrics, segments, and time granularities) to a project.
13. Tableau
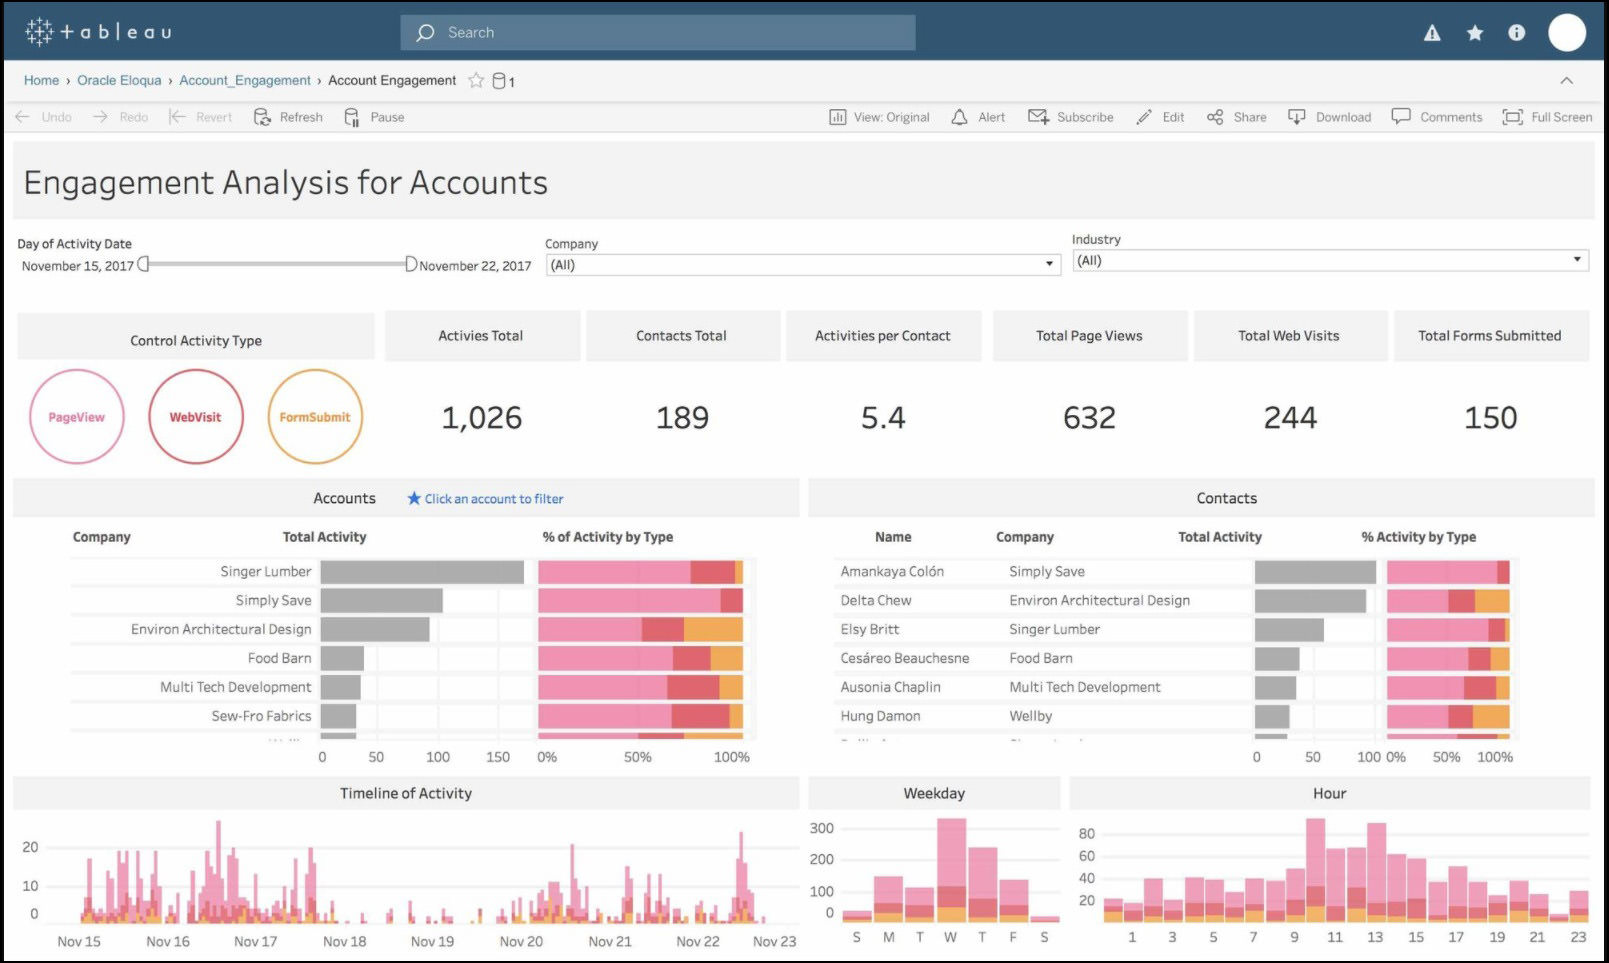
Say hello to Tableau GPT and Tableau Pulse, the next generation of Tableau. Bring analytics to life with AI and personalized insights. Their visual analytics platform is transforming the way people use data to solve problems. See why organizations of all sizes trust Tableau to help them be more data-driven.
Tableau’s live visual analytics and interactive dashboard allow slicing & dicing datasets for generating relevant insights and exploring new opportunities. Users can create interactive maps and analyze data across regions, territories, demographics and more.
Tableau helps to create a narrative story of the data analysis with interactive visualizations that can be shared with their audience. Analytics solutions for industries. Organizations across industries use Tableau to become more data-driven:
- Financial Services – Banking, Insurance, Wealth Management
- Healthcare and Life Sciences – Provider, Payer, Pharmaceutical, Medical Devices
- Public Sector – State and Local, Federal and Defense, Education and Non-Profit
- Retail and Consumer Goods – Consumer Goods, Retail
- Communications and Media
- Industrial Products
- Manufacturing
14. ZEMA
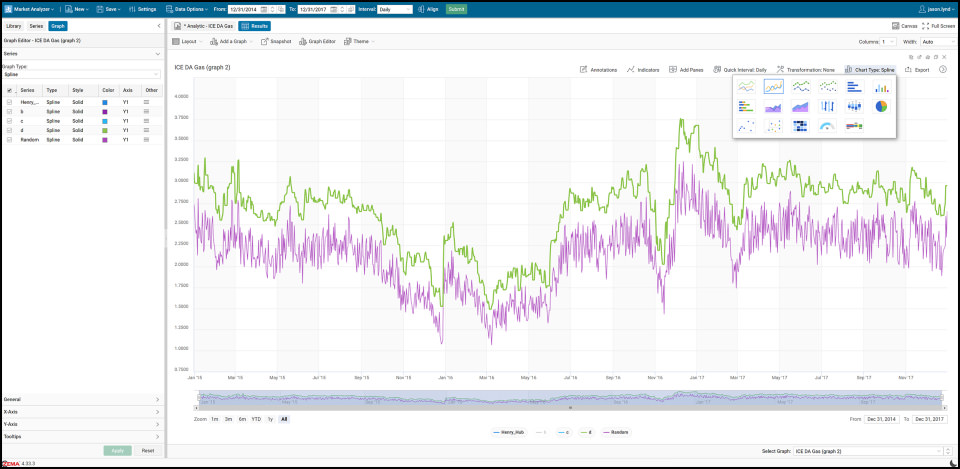
A comprehensive data aggregation, integration; and analytics platform that resolves data management and business process automation challenges. With ZEMA you get unrivaled data collection, analytics, curve management, and integration capabilities. ZEMA is modular and can be configured to meet your business and industry needs.
ZEMA enables organizations to integrate the platform with over 175 third-party applications including enterprise resource planning (ERP), trade and risk, settlement, Snowflake, ETRM, CTRM, SAP, Allegro, Oracle, IBM, Salesforce, Python, QLIK, and R. Other 3rd party applications include business intelligence (BI) solutions such as TIBCO, Spotfire, Tableau, and Power BI. ZEMA Automates Complex, End-to-end Data Management Processes including:
- A single point of data access
- Public, third-party, and proprietary data
- Internal data collection and support
- Real-time data capturing
- Format and industry-agnostic architecture
- Data validation capabilities
- Access controls and data entitlements reporting
- End-to-end data pipeline automation
15. Domo
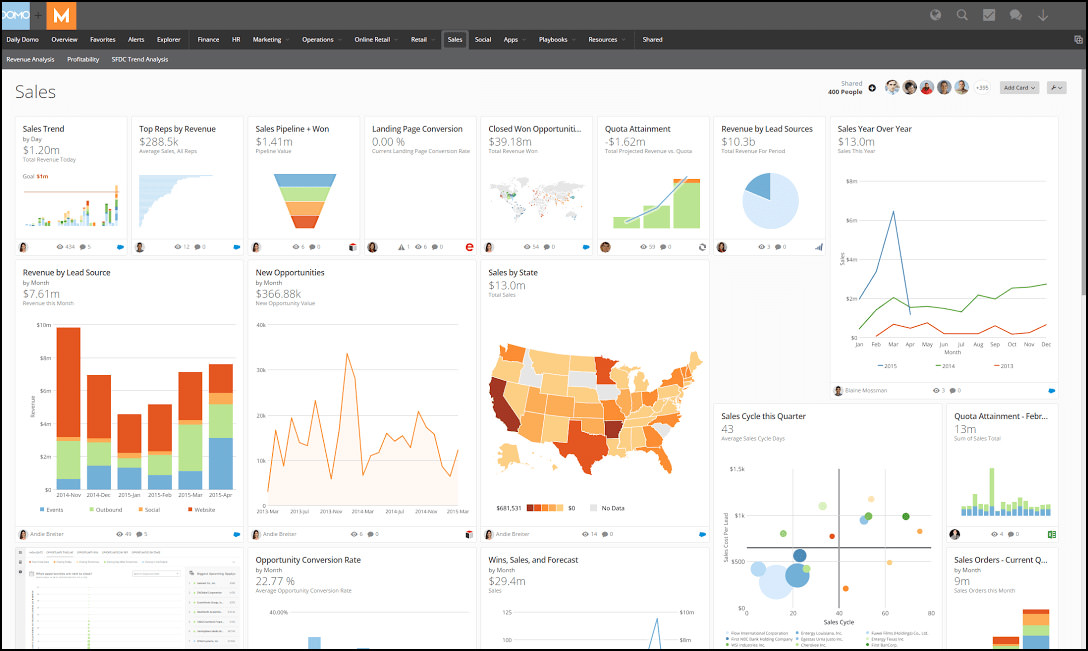
Why Domo? Multiply the business impact of everyone on the org chart. Give every kind of user real-time insights they can act on, with secure, easy-to-use data experiences that drive a culture of data curiosity.
Domo is built to deliver the speed and flexibility that helps businesses achieve enterprise scale. Build and transform massive datasets, implement scalable governance and security that grow with your organization and use enterprise applications to streamline important processes.
16. Grow
At Grow, they believe in enabling businesses of any size in any industry to become truly data-driven. They relentlessly strive to provide the best business intelligence dashboard solution for their customers.
Grow pulls business data from a variety of sources and merges it into one single platform. It supports connection with Salesforce, Dropbox, Google Analytics, Twitter, MySQL, among hundreds of other sources, including databases and spreadsheets. It supports blending, mashing, cleaning, filtering and comparing of data sets from single or multiple sources.
Recommended for you:
 4 Stock Investment Sites With Useful Data, A.I. Analysis, Signals And Discussion
  6 Free Detailed Hardware System Information And Analysis Tools
  7 Free Tools To Change Photo’s Exif Data, Remove Metadata And Hide Dates
  5 Free Bootable Tools To 100% Securely Wipe Clean SSD HDD – Making Data Unrecoverable